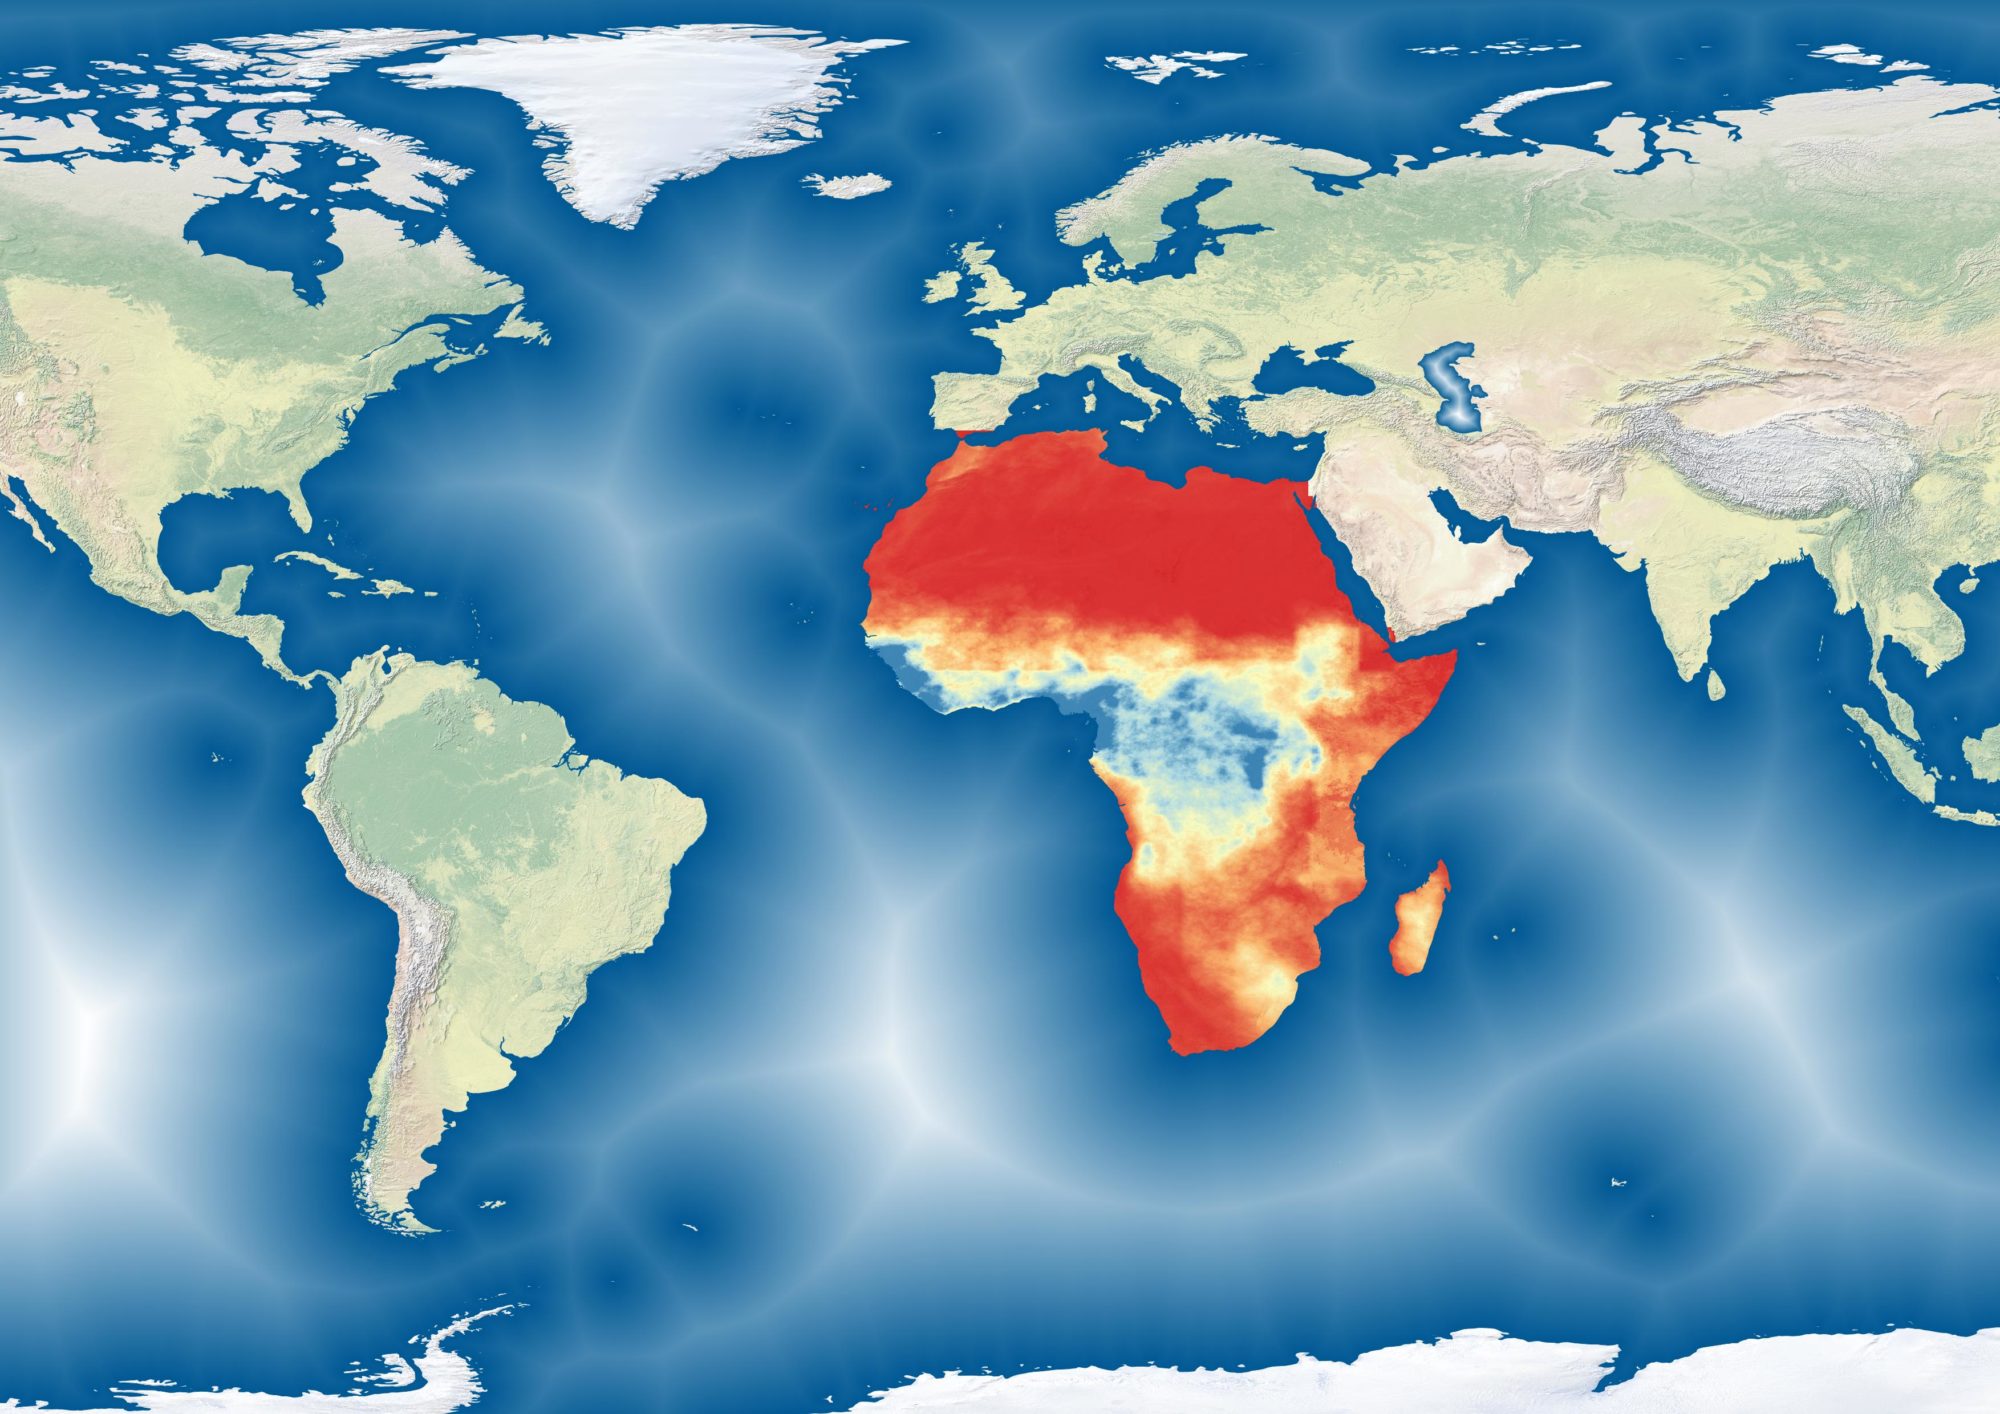

These rasters show recurrent biomass deficits in West Africa between 2015 and 2019. The idea is to show areas at risk of desertification by focusing on recent years of continued degradation. Desertification as a concept has a number of different definitions, many of which are divergent. As a result, this dataset and map may not fit within a specific user’s definition of choice. The goal of this map is not to offer a new definition of desertification or to provide a new lens with which to view it. Rather, the idea is to highlight areas where biomass production is suffering from multi-year degradation.
Method
The BiomassValue Rasters were downloaded from Action Contre la Faim’s geosahel.info platform and show the total annual Dry Matter Productivity (Biomass) at a 1km resolution. The values are expressed in kg/ha. These rasters are built from VITO’s PROBA-V DMP Product
The neg_anomaly_count raster indicate the number of times during the 2015-2019 period that a pixel had an annual biomass production inferior to 80% of its long-term average. These anomalies are calculated from an archive from 1998 to 2019. For instance, a pixel with a value of 3 experienced 3 years during the 2015-2019 period where total production was under 80% of the long-term average.
The neg_anomaly_count_severe raster follows the same logic, however the production threshold is lowered to 50%.
Highlights
A common narrative of desertification hinges on the south-ward advance of the Sahara, inferring that the northern-most fringes of the Sahel belt are most at risk for desertification. However, looking at the past five years of biomass loss does not necessarily enforce this claim. While there are noticeable stretches of biomass deficits in the northern areas, the most alarming zone seems to be Northern Senegal and Southern Mauritania, where biomass production has consistently been below average for the past five years.