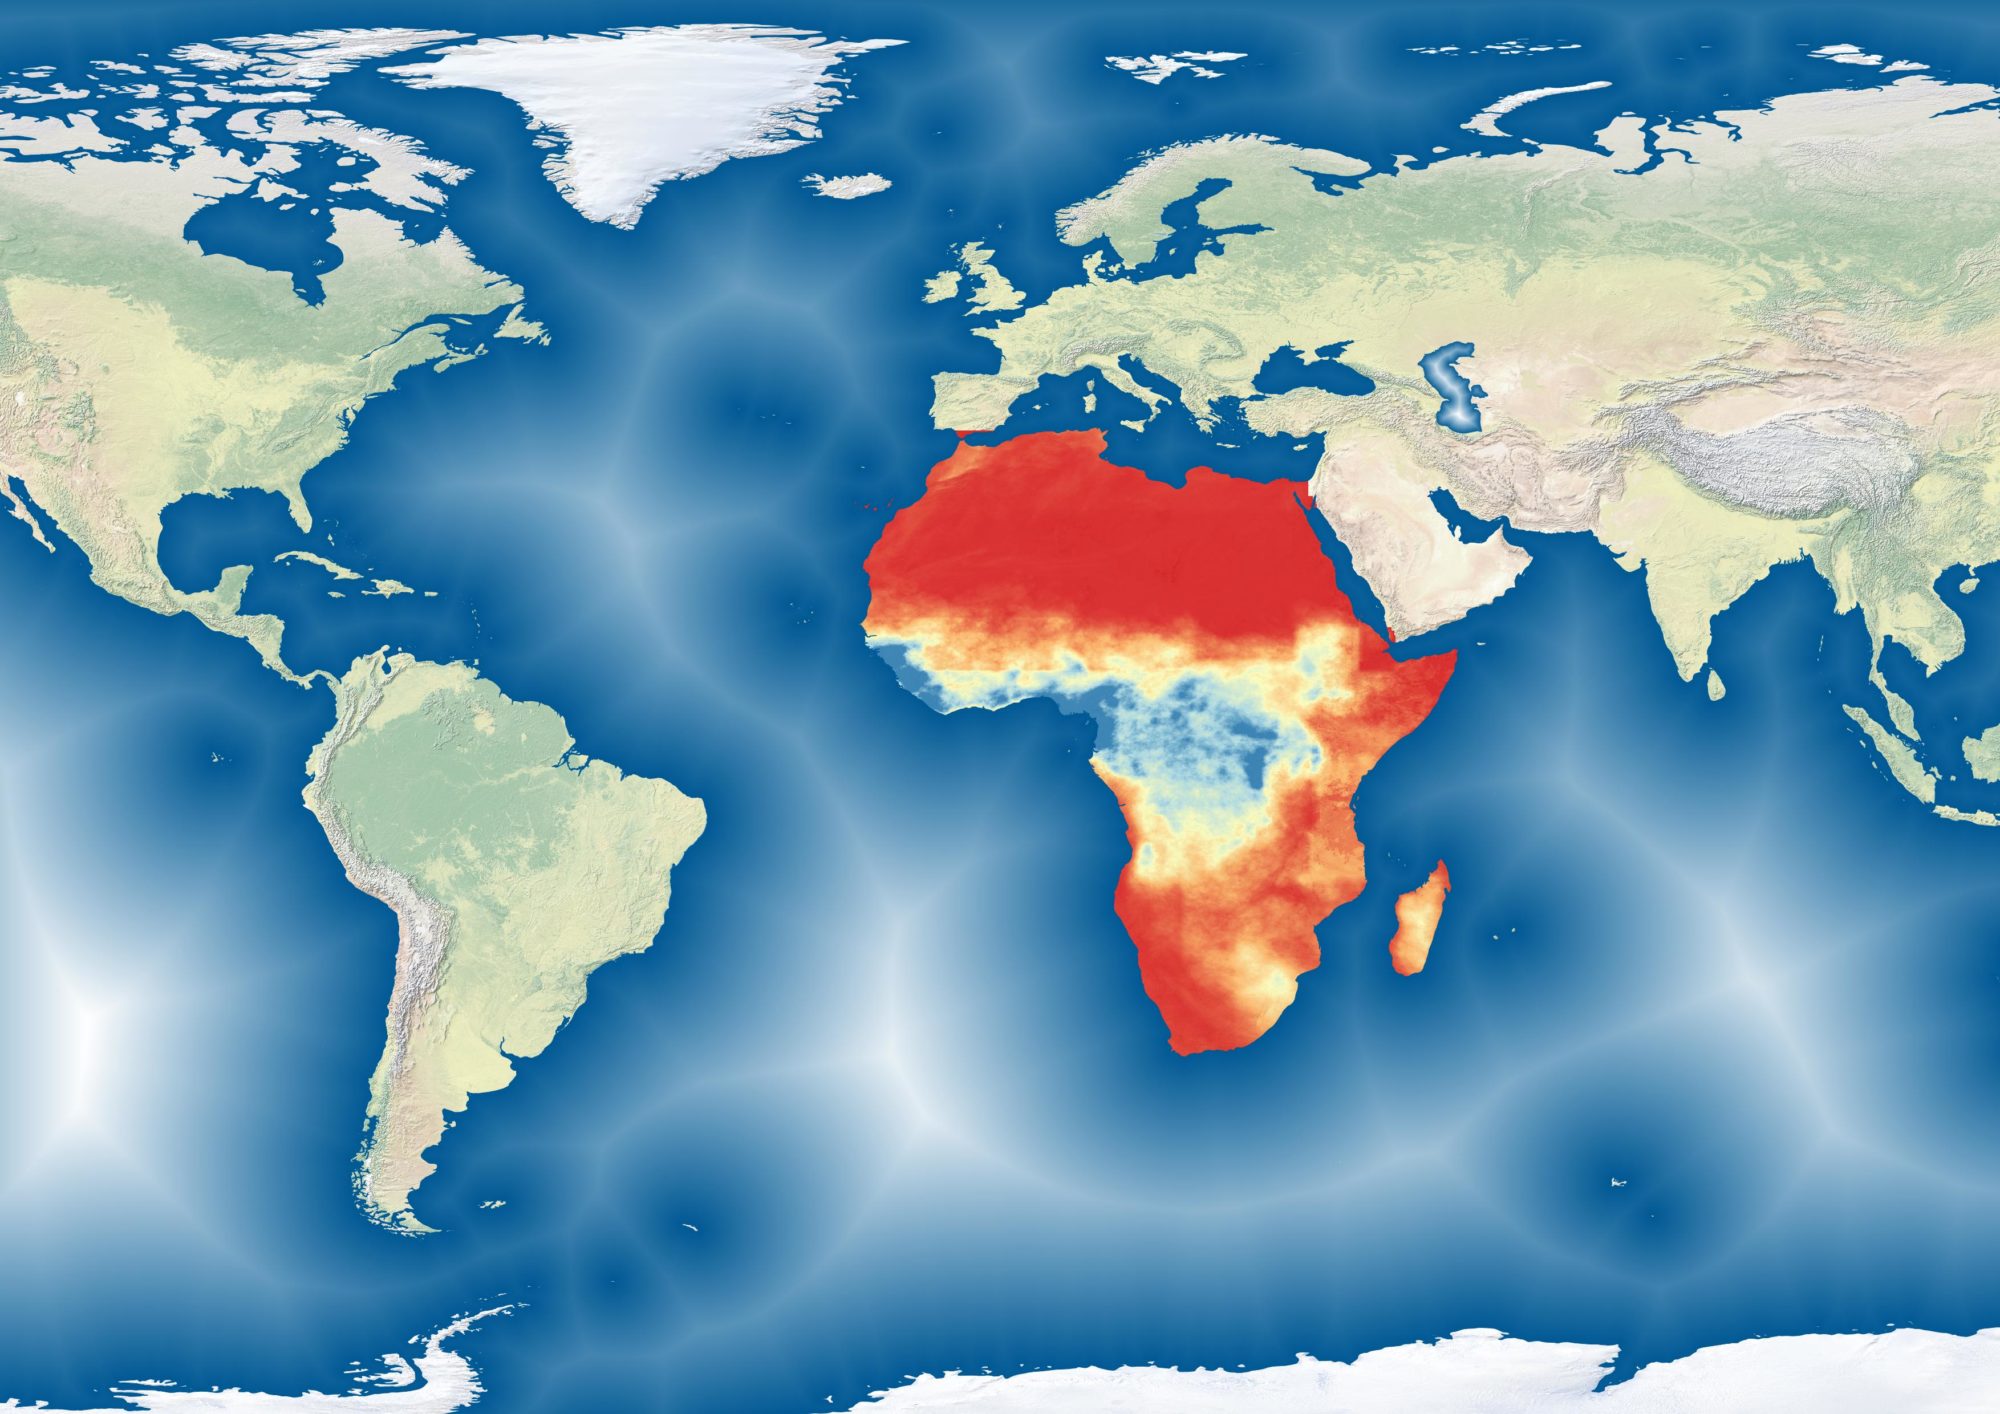
This dashboard, built from Google Earth Engine, lets users visualize 3 Period Timescan images of cropland. These images create an Red-Green-Blue composite of cropland over the course of a growing season. The images highlight the presence of active cropland as blue pixels, allowing for users to easily monitor changes in cropland from one year to another. For more information on 3 Period Timescan please read this article.
Click on an area on the map to visualize the timescan. Use the search bar to find a location but you must click on the map to set the point of interest. Clicking on the map will execute the calculations and start the visualization. The time selection parameters below are by default, set to the West African rainy season. These parameters should allow you to visualize rain-fed cropland as blue pixels on the map. Only change the time parameters if you are looking outside of West Africa. The max NDVI of each period is calculated and stacked into a single Red-Green-Blue composite image (for each year). Credits: Laure Boudinaud (WFP), Alex Orenstein (DaCarte), Vasily Lobanov (RUDN)
To use the dashboard, please visit the following link:
